Tableau · Analytics & BI
Bridges to Prosperity
Testing how far AI-assisted Tableau development can work at source level.
A brownfield Tableau redesign experiment using an existing 2020 Makeover Monday workbook to test whether AI-assisted development could move beyond screenshot critique into direct workbook modification, validation and iteration.
View source on GitHub →The final dashboards
Global overview
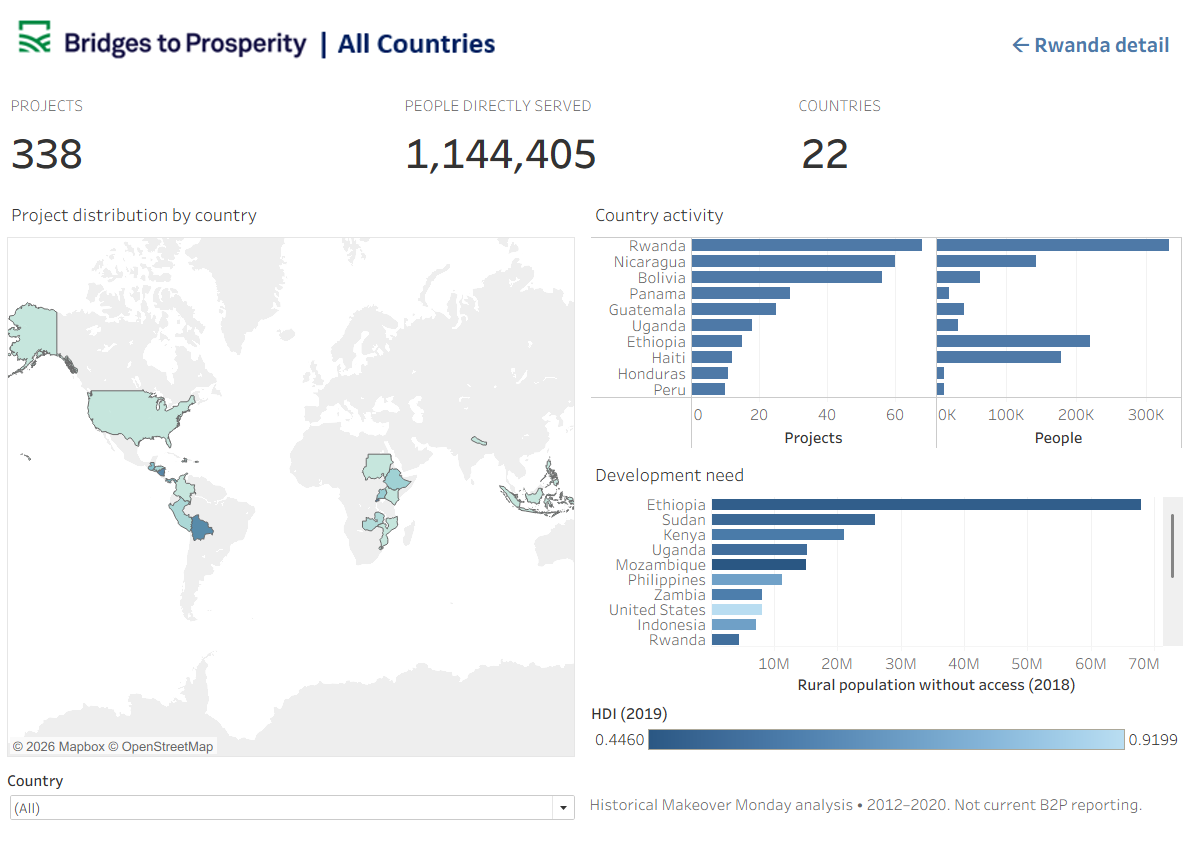
Desktop-finalised global view showing project reach, country activity and development context.
Rwanda detail
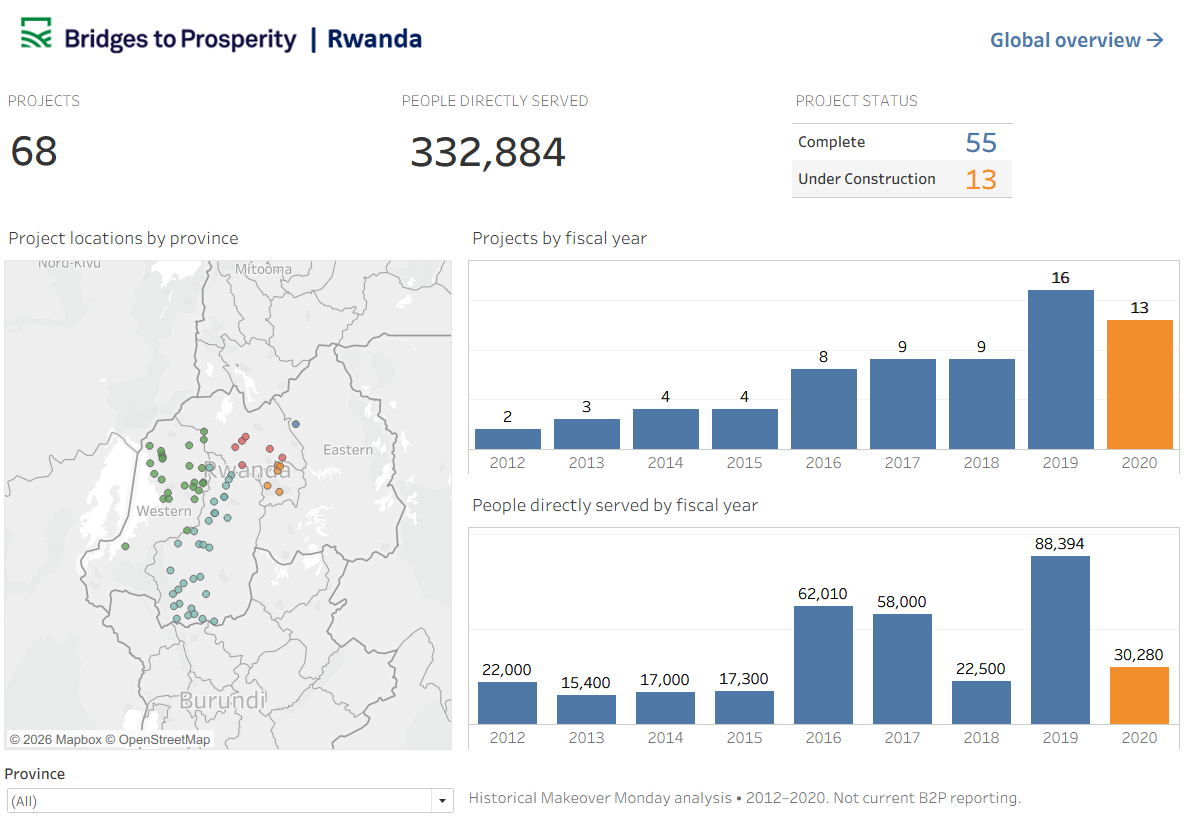
Desktop-finalised Rwanda view combining headline programme metrics, project geography and year-by-year delivery.
The experiment
The original workbook came from a 2020 Makeover Monday exercise. This was a brownfield redesign of an existing packaged Tableau workbook, not a new build from a blank canvas. The packaged TWBX was inspected and brought under Git source control before any modifications were made.
The goal was not simply to ask AI how the dashboard could look better. The experiment tested whether an AI coding workflow could inspect an existing packaged Tableau workbook, understand its structure, modify the underlying workbook source and survive the return journey into Tableau Desktop.
The starting point
The original workbook already contained genuine analytical structure, navigation and multiple views. That made it a useful brownfield test: the question was whether source-level development could improve a real Tableau artefact, not whether a dashboard could be invented from scratch.
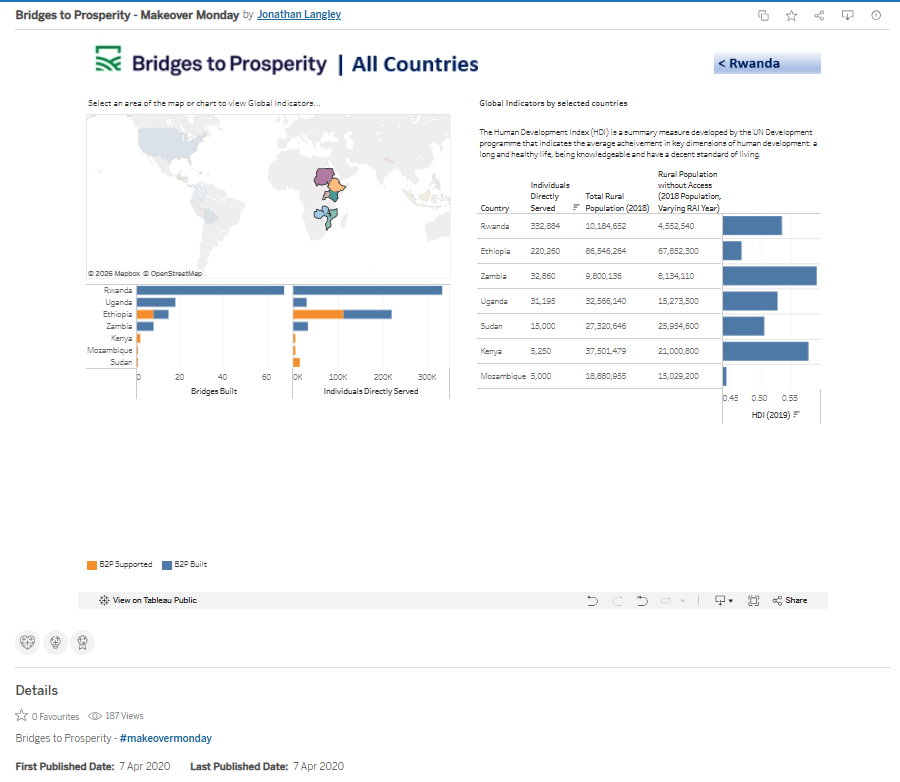
Original 2020 All Countries workbook.
An AI-assisted Tableau workflow
AI was used to inspect the packaged workbook, modify source, and iterate. Opening the result in Tableau Desktop, judging whether it actually rendered correctly, and deciding when to stop remained human decisions.
Where source-level AI worked
Rwanda v1.5
Source-level changes produced a materially redesigned Rwanda dashboard that Tableau Desktop could open and render. The work established a new headline KPI structure, reconstructed the dashboard layout, revised project and year views, and integrated those views with the existing Province filter.
The experiment established that meaningful Tableau dashboard development was possible directly through TWB source modification. That is not the same as claiming AI produced the finished Rwanda dashboard independently. Desktop remaining in the loop was still part of the workflow.
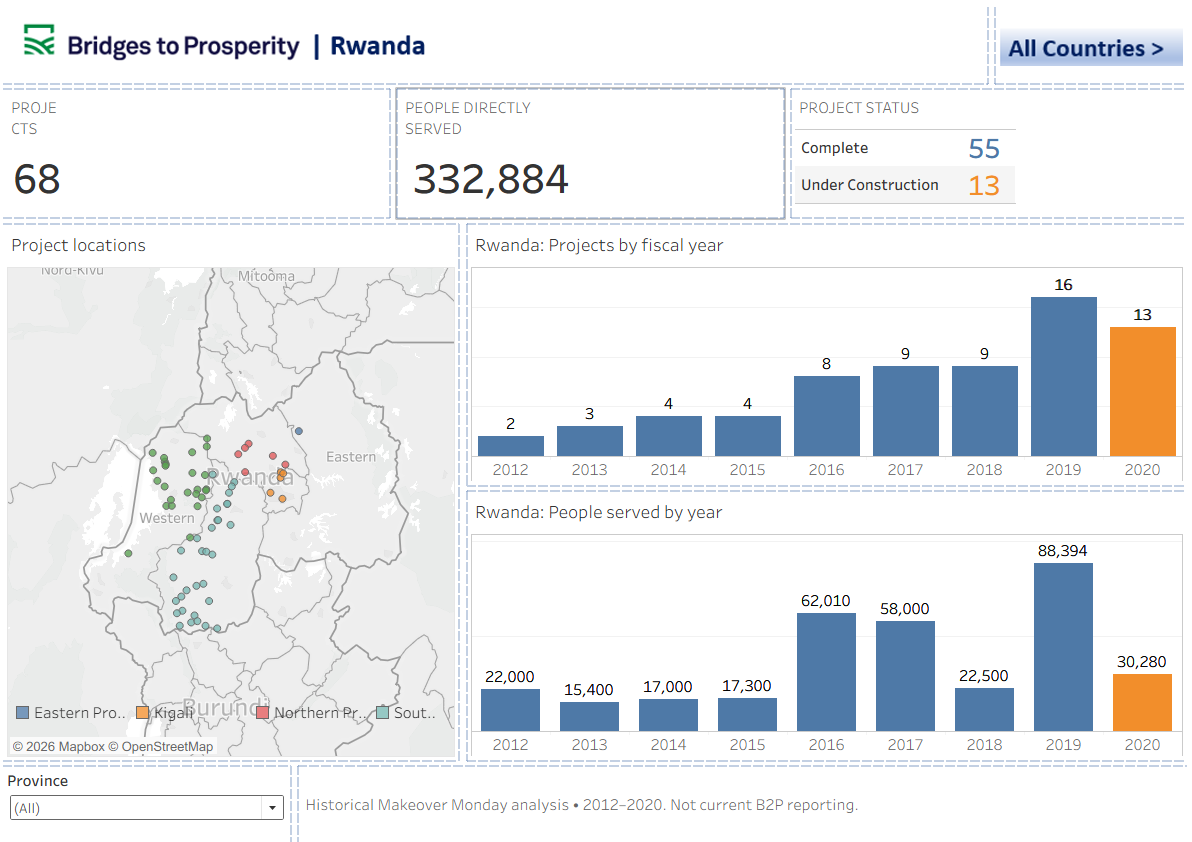
Rwanda after source-level AI modification — opened and rendered in Tableau Desktop.
Where valid source stopped being a valid visualisation
Global v1.6 — valid workbook, broken behaviour
The more ambitious Global source redesign passed static validation. Tableau Desktop opened the workbook without repair. The dashboard itself was substantially broken: the world map collapsed, and the expected Country Activity and Development Context views did not behave correctly.
Valid TWB XML is not valid Tableau visualisation behaviour.
Tableau's rendering semantics, persisted state, filters, actions and workbook relationships cannot be reliably validated by XML syntax alone. A workbook can be well-formed and still fail as an analytical visualisation.
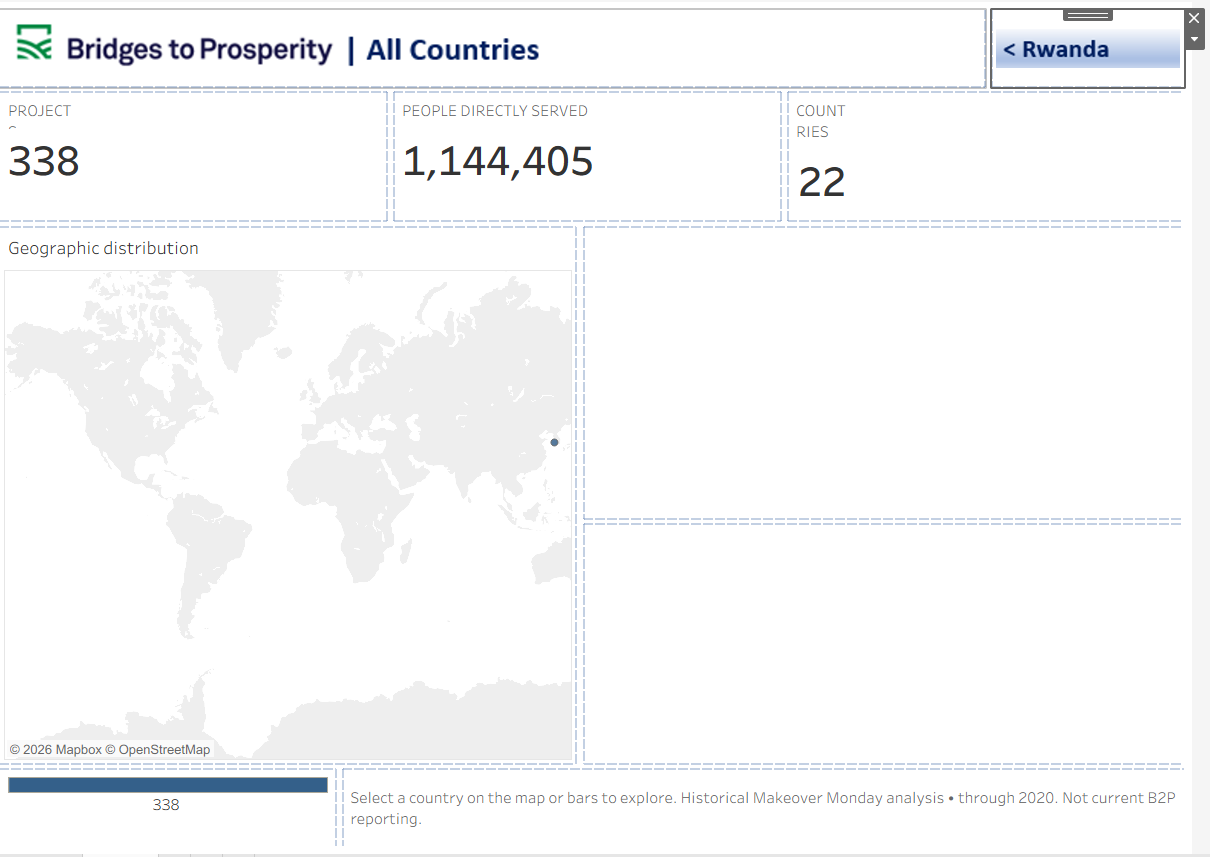
Global v1.6 opened in Tableau Desktop, but the visualisation behaviour was not usable.
Repair what can be validated — then know when to stop
Global v1.6.1 — map behaviour restored
A targeted repair restored map behaviour. More complex action, filter and blend state remained unreliable to author purely through source mutation. Continuing to generate source changes at that point would have increased risk rather than improved the product.
Stopping source mutation was itself a development decision. Complex interaction and layout work moved back into Tableau Desktop for finalisation.
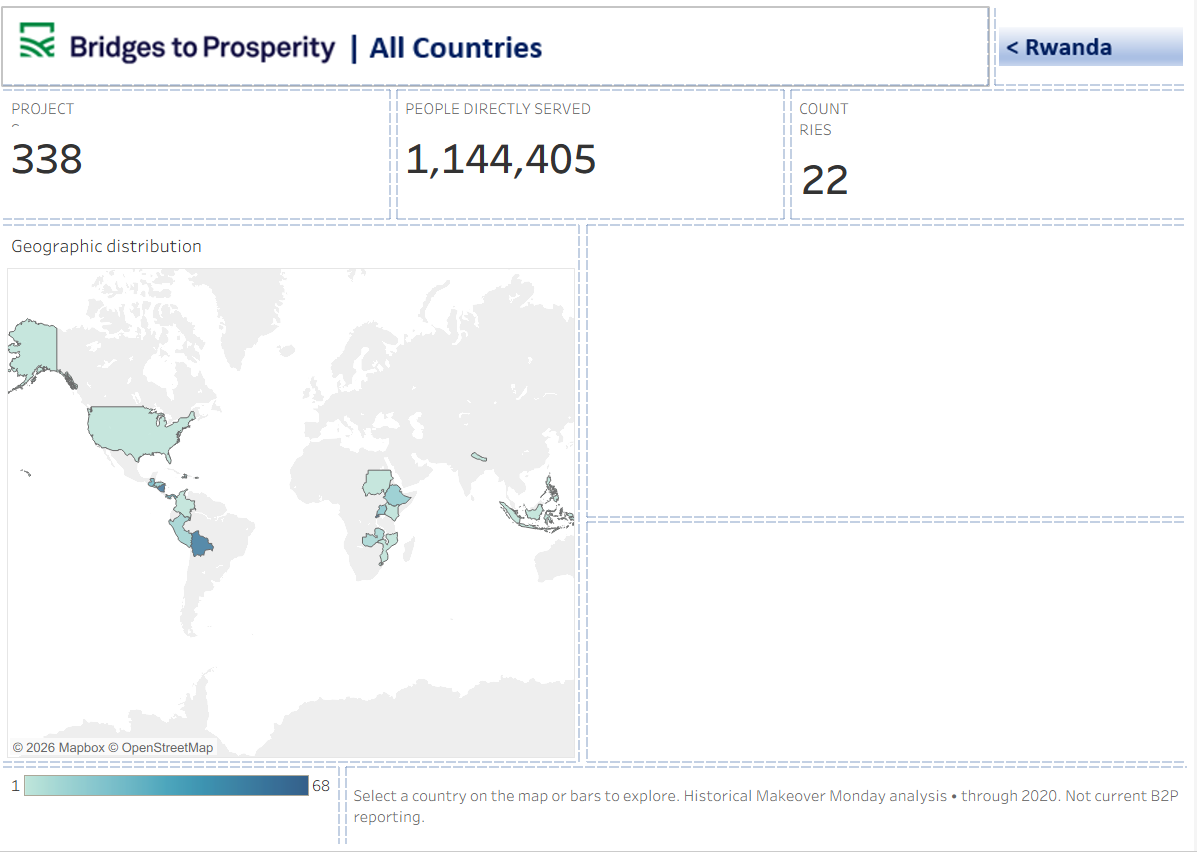
Targeted repair restored the map. Broader interaction state still required Desktop.
Desktop finalisation
Tableau Desktop remained necessary for semantic and render validation, and for the final interaction and layout work. The experiment ended with finished BI artefacts, not an abandoned prototype.
Global
- Projects
- People directly served
- Countries
- Geographic distribution
- Country activity
- Development need / rural population context
- HDI context
- Rwanda navigation
Rwanda
- Projects
- People directly served
- Complete / under construction
- Project locations by province
- Projects by fiscal year
- People served by fiscal year
- Province filtering
- Global navigation
Compared with the Power BI workflow
Haven used Power BI's PBIP/PBIR/TMDL architecture. That provided a more structured and predictable source-level coding-agent workflow: report and semantic-model artefacts were more naturally separated, and easier to inspect and modify incrementally.
Tableau TWB XML proved substantially more editable than might initially be expected. Meaningful dashboard development was possible directly in source. Complex Tableau behaviour remained more brittle, because workbook state, render semantics, filters, actions, blending and dashboard behaviour sit inside a comparatively monolithic source structure.
For this particular AI-assisted development workflow, Power BI's PBIP/PBIR/TMDL architecture proved more predictable for coding-agent modification, while Tableau source was surprisingly editable but complex visual behaviour required substantially more Desktop-based semantic and render validation.
Tableau remained entirely capable as the BI platform; the difference was in how safely the development artefacts could be manipulated outside the authoring environment.
AI accelerated. Human judgement owned the outcome.
AI accelerated
- Workbook inspection
- XML/source modification
- Repetitive implementation
- Iteration
- Structural experimentation
- Static validation
Human judgement owned
- Analytical intent
- Dashboard hierarchy
- Metric interpretation
- Visual acceptance
- Diagnosing render failure
- Deciding when source mutation had become unreliable
- Desktop finalisation
- Final validation
What the project demonstrates
Tableau development
Workbook structure, calculations, dashboard layout, filters and Desktop validation.
Visual analytics
Turning existing analytical content into clearer Global and Rwanda decision-support views.
AI-assisted BI development
Using coding agents against real Tableau source rather than limiting AI to screenshot critique.
Validation discipline
Recognising that syntactic validity is not the same as correct analytical or render behaviour.
Professional judgement
Knowing when source-level development is productive and when to return to the native authoring environment.
Evidence on GitHub
The fuller technical evidence lives in the public repository: workbook and source inspection, version progression from original through AI iterations to the Desktop-finalised workbooks, and the longer case-study documentation.
This page is the professional finding. The repository is the implementation record.
Related experiment
Haven Warranty Analytics — Power BI
The Power BI counterpart, using PBIP/PBIR/TMDL to test a more structured source-level AI-assisted development workflow.